Your Own Energy Data
If your PV system sits behind your grid connection meter, the meter only sees the surplus you feed in and the power you still draw from the grid (see Generation behind the meter). What you produce and use yourself never reaches it, so OpenZEV cannot tell how self-sufficient you really are.
Energy data closes that gap. You connect the system that does measure it — Solar Manager today, or any system that can send or export a file — and OpenZEV adds your real production, consumption, self-consumption and self-sufficiency to the statistics.
Statistics only, never billing
This data is never used for invoices. Billing keeps using the grid operator's meter data alone, exactly as before. A wrong or missing value in your own system can at worst make a statistic wrong or empty; it cannot change an amount.
The feature is on as soon as the platform administrator has set up the
encryption key for integrations (INTEGRATION_ENCRYPTION_KEYS), and can be
switched off again under Platform → Settings → Functions → Supplementary energy
data. While it is off none of what follows is visible.
Who can connect what
What you can connect depends on the kind of data and on who holds the metering point.
| Kind of data | The meter must be | Who connects it |
|---|---|---|
| History (15-minute values, for production and self-sufficiency) | held by you personally and marked Generation behind the meter | the holder |
| Live (values right now) | any meter you hold personally: a plain consumption meter or an EV charger as well | the holder |
| Forecast (expected production) | a producing or bidirectional meter whose plant has roof planes and a building location (see Production forecast) | the holder |
Only the participant who personally holds the metering point can connect a source for it. It is their account and their household, so a ZEV manager cannot connect it for them, cannot see the key and cannot change it. You must hold the meter yourself, not through a shared community allocation. Only the history needs the mark Generation behind the meter, which only a manager can set; live data does not, so a meter without the mark still offers Connect for live data.
Community-operated sources are different: a metering point nobody holds personally (a common area, a spare meter), the community's grid connection point and the forecast of such a plant belong to the community. A manager connects those on the Energy data tab of Settings (see The community's sources).
| Holder (own source) | ZEV manager | ZEV viewer | Other participants | |
|---|---|---|---|---|
| Connect, test, sync, replace the key, import, on a personally held meter | yes | no | no | no |
| Connect, test, replace the key, on a community-operated meter or the grid connection point | n/a | yes | no | no |
| See the status and figures | yes | yes | yes (read-only) | no |
| Switch off, disconnect, delete data, remove a participant's source | yes | switch off or on, delete data, remove (never disconnect, test or touch the key) | no | no |
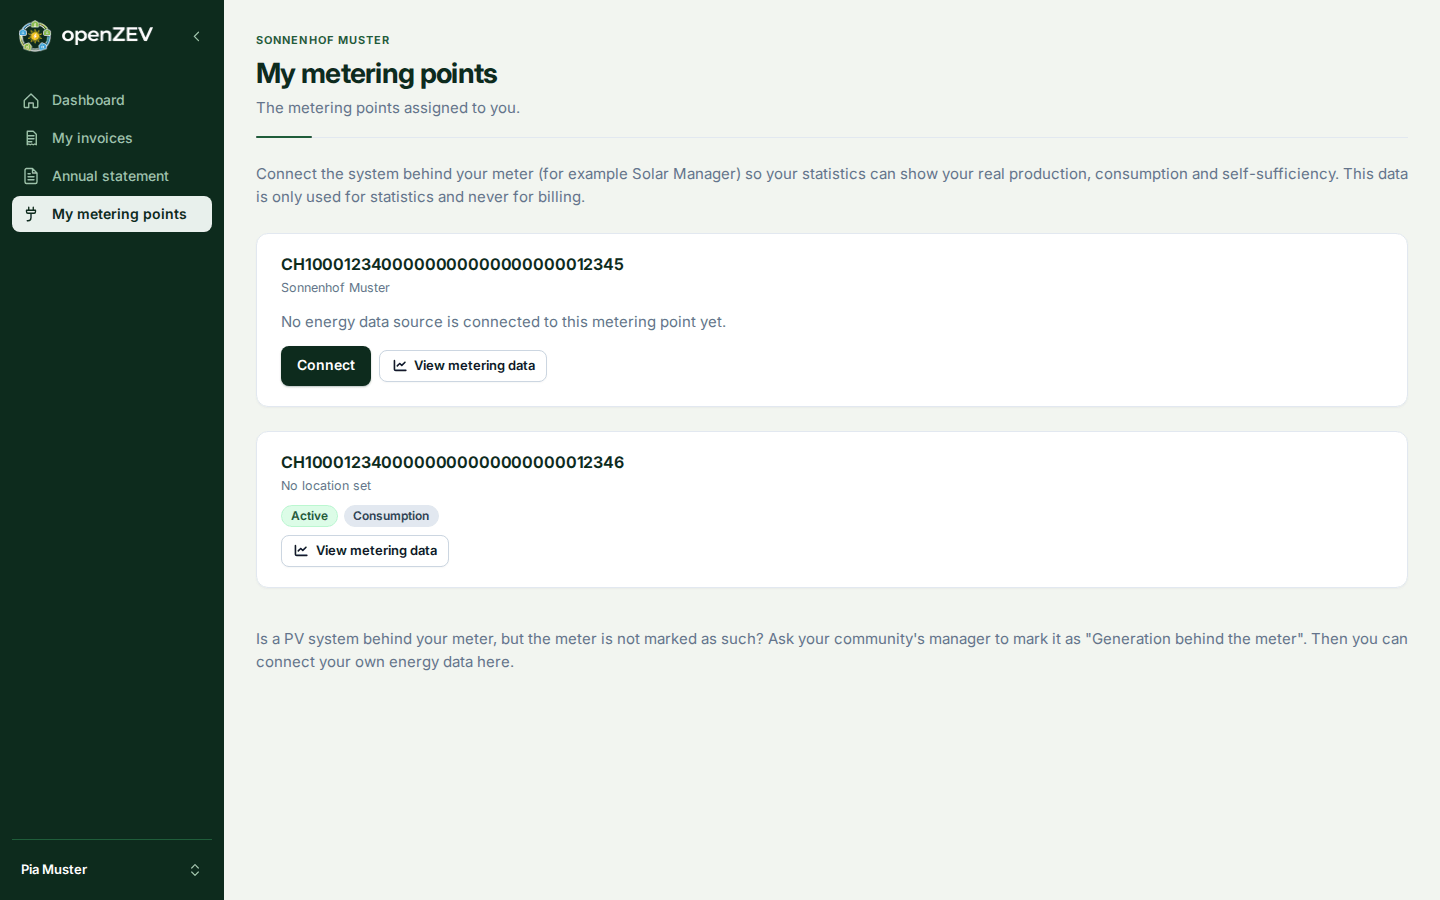
Each metering point on that page has two parts. Grid operator's meter holds the button View meter data, which opens the chart of the readings billing is based on. Your own energy data holds what you connect here (history, live, forecast), which is only shown and used for statistics, never for billing, so the button does not show those figures.
If you are a ZEV manager and hold a metering point yourself, you connect it the same way as any participant: My metering points appears in your menu. A manager who connects their own plant's forecast is told where to enter the roof planes and the building's location (a button leads to the metering points); a participant is told to ask their manager.
When you no longer hold the metering point (the assignment ends), the connection is switched off by itself, the key is deleted, and nothing new is collected. The data already collected is kept until you or a manager deletes it.
Connect Solar Manager
- Create an API key in your Solar Manager account.
- In OpenZEV open My metering points in the menu. The metering points that you hold yourself carry the energy data setup. For history, the meter must also be marked Generation behind the meter; for live data and the forecast it does not need that mark.
- Choose Connect on the metering point.
- Pick Solar Manager, enter your Solar Manager ID (3 to 24 letters or digits) and the API key, and read what you agree to.
- Tick the consent box and choose Connect.
OpenZEV checks the key with Solar Manager before anything is saved, so a wrong key never leaves a half-connected source behind. The key is stored encrypted, only used to fetch your data, and never shown again. The first data arrives within a few minutes; after that OpenZEV fetches new data every hour and re-reads the last two days to pick up late corrections.
Solar Manager replaces your key with a fresh one every time it is used, and OpenZEV keeps the fresh one. If the connection ever shows Reconnect needed, the key no longer works (for example because you revoked it): choose Reconnect and enter a new key.
Live data from Solar Manager
The same Solar Manager connection can also supply live data: choose Live data (alone or together with history) when you connect, or use Also send live data with this source on a connection you already have; the stored key is reused, you only confirm the live consent. OpenZEV then reads the current power from your Solar Manager account, but only while someone has the live page of the ZEV open (about every 30 seconds, and it stops shortly after the last person leaves), so an unwatched ZEV costs your account no requests. Live values are shown and never stored as history. If Solar Manager limits requests, OpenZEV waits and tries again by itself. Live data from a ZEV-operated meter or the grid connection point still comes from a push source: a Solar Manager key is your personal credential, so a manager cannot connect one on your behalf.
Live data from your own system
A meter that only reports its current power needs no history: on My metering points its row says Live (now) and Not connected, with its own Connect. Choose Own system and your system (Home Assistant, Shelly, a script) sends the current power with a push token, as described under Send live power. Where a point could provide both history and live data and neither is connected yet, a single Connect energy data at the bottom of the card starts both together; with only one missing, the Connect in its row is the only button. A community manager connects live data for meters nobody holds personally and for the grid connection point on the Energy data tab of the settings (below).
What is stored
Four values per quarter hour: consumption, production, grid import and grid export, in kWh. Nothing else from your Solar Manager account is read. Only the time you held the metering point is stored.
Send the data yourself (push or file)
If you do not use Solar Manager — for instance with Home Assistant, n8n or a script — choose Own system / file when you connect. You get a push token shown once; copy it right away. OpenZEV stores only a hash, so if you lose it you issue a new one (New push token), which stops the old one at once. The token also appears under Account → Tokens & keys with when it was issued and last used; there you can issue a new one or revoke it. Revoking drops only the token: the source and its readings stay, and the device is rejected until you issue a new token.
Send readings with an HTTP POST:
curl -X POST "https://your-openzev.example.com/api/v1/metering/supplementary/ingest/" \
  -H "Authorization: Bearer ozs_abcd1234_yourtoken" \
  -H "Content-Type: application/json" \
  -d '{"readings": [
        {"timestamp": "2026-07-01T10:00:00+02:00",
         "consumption_kwh": 0.42, "production_kwh": 1.31,
         "import_kwh": 0.05, "export_kwh": 0.94}
      ]}'
The rules, so that nothing is silently wrong:
- One reading per quarter hour, with the timestamp of the interval's
start (
10:00means 10:00 to 10:15) on a quarter-hour boundary (:00,:15,:30,:45) and a UTC offset. - kWh used in that quarter hour, not a running total and not watts. If your system reports a meter reading that only ever grows, send the difference.
- No negative values, no future timestamps, at most 2000 readings per request and about 120 requests per hour.
- Sending the same timestamp again replaces the earlier value, so a retry is harmless.
- A bad reading is rejected on its own, with its position and the reason; the good ones in the same request are still stored.
Home Assistant example
With a utility_meter per value (cycle quarter-hourly), an automation can send
the previous quarter hour shortly after each boundary. The entity names below are
placeholders for your own sensors:
rest_command:
  openzev_push:
    url: "https://your-openzev.example.com/api/v1/metering/supplementary/ingest/"
    method: POST
    headers:
      Authorization: "Bearer ozs_abcd1234_yourtoken"
      Content-Type: "application/json"
    payload: >
      {"readings": [{
        "timestamp": "{{ timestamp }}",
        "consumption_kwh": {{ consumption }}, "production_kwh": {{ production }},
        "import_kwh": {{ import_kwh }}, "export_kwh": {{ export }}
      }]}

automation:

  - alias: Send energy data to OpenZEV
    trigger:
      - platform: time_pattern
        minutes: "/15"
        seconds: 30
    action:
      - service: rest_command.openzev_push
        data:
          timestamp: >
            {{ (now().replace(second=0, microsecond=0, minute=(now().minute // 15) * 15) - timedelta(minutes=15)).isoformat() }}
          consumption: "{{ state_attr('sensor.house_consumption_quarter_hour', 'last_period') | float(0) }}"
          production: "{{ state_attr('sensor.pv_production_quarter_hour', 'last_period') | float(0) }}"
          import_kwh: "{{ state_attr('sensor.grid_import_quarter_hour', 'last_period') | float(0) }}"
          export: "{{ state_attr('sensor.grid_export_quarter_hour', 'last_period') | float(0) }}"
Upload a CSV file
For a one-off import or to fill a gap, choose Import CSV on the source. The columns are:
timestamp,consumption_kwh,production_kwh,import_kwh,export_kwh
2026-07-01T10:00:00+02:00,0.42,1.31,0.05,0.94
Semicolons and decimal commas (as in a Swiss Excel export) are accepted. Choose Check file first: it reports the problems row by row and imports nothing. Import stores the file only if every row is valid.
Send live power (push)
A live source reports the current power instead of kWh per quarter hour. Choose Live data and
Own system / file when you connect; the push token is shown once, exactly as for the history above.
Send one value every 10 seconds (the server accepts one every 5 seconds and answers 429 with a
Retry-After header if you are faster):
curl -X POST "https://your-openzev.example.com/api/v1/metering/live/ingest/" \
  -H "Authorization: Bearer ozs_abcd1234_yourtoken" \
  -H "Content-Type: application/json" \
  -d '{"meter_power_w": -3120.5}'
meter_power_w(required) is the power at your meter, in watts, signed like the meter: positive while you draw from the grid or the ZEV, negative while you feed in. A producing plant therefore sends a negative number, a flat a positive one, and a household with PV behind its meter the net of both. For the grid connection point it is the net power there: positive while the ZEV as a whole imports.timestamp(optional, with a UTC offset) is when the value was measured; without it the server's receive time is used. A value older than 60 seconds is rejected, and one that is not refreshed within 60 seconds counts as missing on the page.production_wandconsumption_w(optional, not negative) are your system's own gross figures, for the Your own system view; the ZEV figures usemeter_power_wonly.- Values are kept only briefly, for today's curve, and not stored as history. They are never used for billing.
Home Assistant: send the power
Use the sensor that shows the power at your meter in watts, positive for import, negative for export (the name below is a placeholder). The condition skips a tick while the sensor is unavailable, so a gap shows as a gap rather than as a zero:
rest_command:
  openzev_live:
    url: "https://your-openzev.example.com/api/v1/metering/live/ingest/"
    method: POST
    headers:
      Authorization: "Bearer ozs_abcd1234_yourtoken"
      Content-Type: "application/json"
    payload: '{"meter_power_w": {{ power }}}'

automation:

  - alias: Send live power to OpenZEV
    trigger:
      - platform: time_pattern
        seconds: "/10"
    condition:
      - condition: template
        value_template: "{{ states('sensor.grid_power') | is_number }}"
    action:
      - service: rest_command.openzev_live
        data:
          power: "{{ states('sensor.grid_power') | float }}"
Shelly (Gen2 and newer): send the power from a script
On a Shelly Pro 3EM, open Scripts, create a script, paste the following and enable Run on startup. It reads the total active power of the meter (positive for import, negative for export) every 10 seconds:
let URL = "https://your-openzev.example.com/api/v1/metering/live/ingest/";
let TOKEN = "ozs_abcd1234_yourtoken";

Timer.set(10000, true, function () {
  let em = Shelly.getComponentStatus("em:0");
  if (!em || typeof em.total_act_power !== "number") {
    return; // nothing to report: send nothing rather than a zero
  }
  Shelly.call("HTTP.Request", {
    method: "POST",
    url: URL,
    headers: { "Authorization": "Bearer " + TOKEN, "Content-Type": "application/json" },
    body: JSON.stringify({ meter_power_w: em.total_act_power }),
    timeout: 5,
  });
});
Other devices report the same figure under another name: a Shelly EM Gen3 or Pro EM has it as
em1:0 with act_power, a Plug or Pro 1PM as switch:0 with apower (a consumer, never negative).
Check the sign once: with the plant running and nothing else on, the value must be negative. If it is
the other way round, send -em.total_act_power. The Shelly needs https with
a public certificate, as OpenZEV serves it.
Read it back: automations
To switch a load on spare power, read the participant's own live view with a personal API key (a read-only key is enough):
curl -H "Authorization: Api-Key ozv_3f9a1c04b7e2_kR8vN2pQ..." \
     https://your-openzev.example.com/api/v1/metering/live/me/
{"zevs": [{
  "zev_id": "…", "zev_name": "ZEV Sonnenhof", "tier": "exact", "as_of": "2026-11-03T11:02:10Z",
  "production_w": 8000.0, "surplus_w": 3000.0, "local_share_pct": 100.0,
  "own_consumption_w": 1200.0, "own_local_w": 1200.0,
  "forecast_next_peak": {"from": "2026-11-03T10:00:00Z", "to": "2026-11-03T14:00:00Z", "peak_w": 7900.0}
}]}
One entry per ZEV you take part in. surplus_w, local_share_pct and own_local_w are null unless tier
is exact; production_w is null at tier none. Do not read a missing number as zero: test the tier.
forecast_next_peak is the coming window of highest expected production, null without a forecast.
A key may make 720 requests an hour; every 30 seconds is plenty.
Home Assistant: read the surplus
rest:

  - resource: https://your-openzev.example.com/api/v1/metering/live/me/
    scan_interval: 30
    headers:
      Authorization: "Api-Key ozv_3f9a1c04b7e2_kR8vN2pQ..."
    sensor:
      - name: OpenZEV surplus
        unique_id: openzev_surplus
        value_template: "{{ value_json.zevs[0].surplus_w }}"
        unit_of_measurement: W
        device_class: power
        json_attributes_path: "$.zevs[0]"
        json_attributes: [tier, local_share_pct, production_w, own_local_w, forecast_next_peak, as_of]
The sensor is unknown while the surplus is not exact, so an automation that starts the washing machine
or charges the car should use a numeric_state trigger on the sensor, for example above 2000 W for two
minutes, and check state_attr('sensor.openzev_surplus', 'tier') == 'exact'. In n8n use an HTTP Request
node with the same header. Managers and viewers can ask the same of an
AI assistant (tool live_energy).
What you see
My energy system
Everything your own devices report lives on the page My energy system in the sidebar. For managers and viewers the same page is called Live energy: they see the whole community there and pick a participant for the own-system views. Your dashboard (Energy balance for managers) keeps the grid operator's official figures and only points to this page, with a link that opens the same period.
Right now is at the top: what your community produces and uses at this moment, marked Live, indicative and never used for billing. If you have a live source, your own consumption and production come first, with how much of it was local and how much came from or went to the grid; the ZEV's ZEV production, ZEV consumption, Spare now and Local share follow, all as tiles in one row (they wrap on a narrow screen). Where the ZEV's consumption is not known, the tile says in a note behind its info mark that the other participants' use is unknown. Nothing is estimated: a meter that does not report is simply missing. If your own source has stopped reporting, a warning under Right now says so and links to My metering points, where you can look at the connection. Without any live source the page says so: a manager or a participant gets a button to connect one, a viewer is told that the community's management can.
Managers and viewers also get Live values per metering point: a table (a small card per point on a phone) with each point's power, how old the value is and its state. A power reads in words (6.2 kW produced, 2.0 kW to the grid), not with the meter's minus sign. The table is closed; its title says how many metering points have no current value. For a point of the community with no source it offers Connect, and for one a participant holds it says the participant connects it.
Below it the views are chosen with the tabs Today, Tomorrow (when there is a forecast for it), 7 days and Period (the billing period, with the usual period selector). A participant who cannot have a history (no plant behind their meter) sees only Today. Managers and viewers pick the participant whose system they want to see, above the tabs; a manager who is a participant with a connected source starts on themselves. Where the community has no source that could provide a history, live values or a forecast, there are no tabs and no picker, only the note on how to connect one. When a manager looks at somebody else, the chart and the notes speak of the person rather than of "you".
Today draws your own consumption (and production, if you have a PV system) in one line: from your source's history up to its last synchronisation (solid line), and from live values after that (dashed line). A marker shows where history hands over to live. Where neither has a value, the line has a gap; nothing is estimated. The ZEV's totals in the same chart are live only. With a production forecast, its expected production is drawn dashed, and the highest expected production of the day is named above the chart. 7 days and Period show the card described below.
With a connected source, the card Your own system shows production, consumption, self-consumption, grid import and export, your self-sufficiency and self-consumption rates, and a chart. It always says the figures are reported by your own system, not read from the meter, and which period they cover.
- Self-sufficiency — the share of what you consume that did not come from the grid: one minus grid import divided by consumption.
- Self-consumption — the share of what you produce that you used directly.
Both are computed from your own system's numbers alone, so numerator and denominator are measured the same way. The meter is only used to check them.
The 24-hour consumption profile below the cards adds a dashed line, Consumption (own system), with your own system's average consumption per hour of the day, next to the bars measured at the meter. A note under the chart says the line is reported by your own system. Like the rates, it only appears when there is enough data in the period.
The surplus metering badge explains where the figures come from: without a connected source it says no rate can be shown, with one it says the meter only measures surplus and grid draw, and consumption, production and rate come from your own system.
Gaps are shown as dashes, not as low rates
A rate is only shown when at least 95 % of the quarter hours in the period are present. With less, the rate is — and a short reason says so ("not enough data in this period"). A missing hour never turns into a low self-sufficiency. The energy sums are still shown.
Owners, reports and statements
- The ZEV manager's Energy balance shows the same rate in the participant table, marked with an info icon. The Consumption and Production/Export columns keep the meter value and add the own system's figure under it (Own system: x kWh, also marked with an info icon, and only with enough data). Selecting a participant draws their own-system line in the 24-hour profile; the full card is on Live energy (My energy system for a participant), which the dashboard links to. A manager who is also a participant has their own row marked You. Selecting a row in the table again clears the selection.
- The annual report shows it per participant.
- The annual statement PDF shows your self-sufficiency for every month with enough data, — for the others, and a note saying the figures come from your own system.
- The AI assistant tools report it as
gross_self_sufficiency_pctandgross_self_consumption_pct.
Production forecast
OpenZEV can show when your community's plants are expected to produce most, today and tomorrow. It is an estimate from the weather and the plants' setup, never a measurement, and it says when production is expected, not that power will be spare. It is never used for billing.
A forecast needs three things, set up in three places:
- Roof planes of the plant: size (kWp), tilt and direction. In the metering point list, open the menu of the producing metering point and choose Roof planes; a plant on an east and a west roof has two. Direction is 0 for south, 90 for west, -90 for east and 180 for north.
- The building's location, in the building's settings (latitude and longitude; Locate from address fills them in, and sends the address to OpenStreetMap's Nominatim service to do so). The roof planes dialog tells you while the location is still missing, with a button to the building.
- A forecast source on the producing metering point: Connect forecast uses the free public service forecast.solar, with nothing to sign in to. Only the location, rounded to about one kilometre, and the roof planes' size, tilt and direction are sent. If the plant already has a Solar Manager connection, its own forecast can be switched on instead (Also use the Solar Manager forecast).
Managers connect the forecast for ZEV-operated plants; a participant connects it for a meter they hold, and a manager enters the roof planes and the location. Once connected the forecast is fetched every hour. Tomorrow appears on that page as soon as there is a forecast for it.
Does it match the meter?
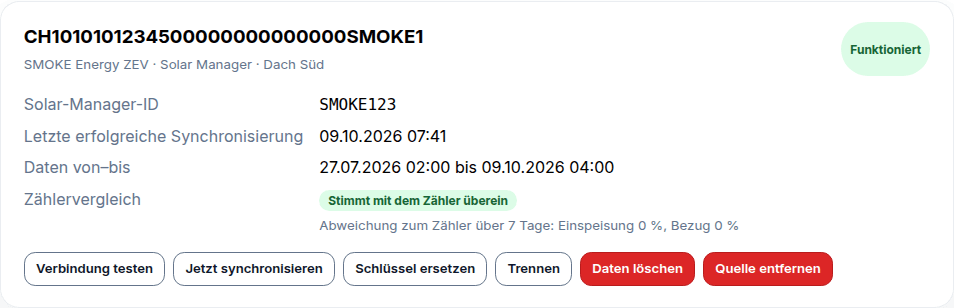
After every sync OpenZEV compares your export and import with the grid operator's meter for the newest days present in both. This is only a check — the meter always wins and nothing is corrected. The result shows on the source:
- Matches the meter — the difference is below 10 %.
- Differs from the meter — more than that. A typical cause is the wrong unit (Wh sent as kWh) in a push client.
- The timestamps look shifted — your values fit the meter better one or two quarter hours earlier or later, which usually means the interval start and end were mixed up.
- Not enough to compare — there are fewer than two days present in both, for example because the meter data has not been imported yet.
Open a source
On My metering points, choosing a source on a meter's card (or Open in My connections, which appears once you have two or more connections) opens its details beside the cards; on a narrow screen they take the place of the cards until you close them with the X or the browser's Back button. The card whose source is open is outlined. The address keeps the choice, so a reload or a shared link opens the same source. The details show one block per thing the source provides (history, live, forecast), the one button you need most (Sync now, or Reconnect when the key no longer works) and a ⋯ menu with the rest: test the connection, replace the key, send a new push token, switch a kind of data on or off, disconnect, delete data or remove the source. The Solar Manager ID, the token and the addresses to send data to are under Technical details. Nothing is coloured while a source works; only a problem, such as a source that has gone quiet, is shown in colour. If you have typed a new Solar Manager key and not saved it, closing asks before it is lost. After you connect a source, it opens there by itself.
The community's sources (managers)
The metering point list shows nothing about energy data. What a manager looks after is on the Energy data tab of Settings (it appears while the feature is on): every source of the community in one list, the grid connection point first, with who holds it and what it provides. Nothing is coloured while a source works; a source that has gone quiet or failed shows its problem in red text. Choose a source to open its details beside the list. Until the first source exists the tab shows a single explanation with one Connect a source button; the introduction and the button in the toolbar come with the first source. Both say where participants connect their own sources: a link to My metering points if you hold a meter yourself and have that page, the name of the page otherwise.
The tab is only there while the energy data feature is on, so a community without it shows six tabs. It is not an empty tab with instructions, because only the platform administrator can switch the feature on (Platform → Settings → Functions).
- Your community's own sources. Connect a source asks Which data do you want to show?, with the grid connection point and every metering point nobody holds personally (a common area, a spare meter) to choose from. For the choice it then lists what can still be connected: live data, or the production forecast of such a plant. You have every action there, as a participant has on their own source.
- A participant's source. You see its state and can switch it off (or on again), delete its data or remove it, each after a confirmation. The key, the push token and the connection itself stay the participant's. If you hold the meter yourself, the details point you to My metering points.
- Viewers see the list and the state, without any action.
Disconnect, delete, remove
| Action | Stops new data | Deletes data | Keeps the connection |
|---|---|---|---|
| Disconnect | yes | no (and it is still used for statistics) | no (key and token are deleted) |
| Delete data | no | yes, all readings | yes |
| Remove source | yes | yes, all readings | no |
In the source's details these three are the last section of the ⋯ menu, in red, away from the everyday actions, and each asks for confirmation. A ZEV manager can switch a participant's source off or on, delete its data or remove it (on the Energy data tab below), but cannot disconnect it, test it or touch its key. Deleting a participant or a metering point deletes their sources and readings with them.
Troubleshooting
There is no Connect button on my metering point. The feature is off, or you do not personally hold the metering point (a shared community allocation does not count). For live data that is all it takes. For history (production and self-sufficiency) the meter must also be marked Generation behind the meter; only a ZEV manager can set that mark, so ask them (My metering points says so too, below the meters). A meter nobody holds personally is connected by a manager on the Energy data tab of Settings, not by a participant.
"Not accepted" when connecting. The key or the Solar Manager ID is wrong. The ID is the one of your installation, not your login name.
Live data from Solar Manager shows "no data". Values are only fetched while someone has the live page open, so open it and wait half a minute. If the connection shows Reconnect needed, the key no longer works for history and live alike: choose Reconnect and enter a new key. Test reads one current-power value to check the connection.
A push to the live endpoint answers 429. You send faster than every 5 seconds, or from several scripts with the
same token. Send every 10 seconds from one place. 403 means the source is switched off or the meter is
no longer yours; 400 with older than 60 seconds means the device's clock is wrong.
The server says the key cannot be stored. The platform administrator has not
set up the encryption key for integrations (INTEGRATION_ENCRYPTION_KEYS). Push
and file import still work without it.
The rate stays a dash. Less than 95 % of the period is covered. Look at Data covers on the source, and use Sync now or Import CSV to fill a gap.
Sync now says to wait. One manual sync every five minutes is allowed; the hourly one runs anyway.
Next Steps
- Metering points — mark generation behind the meter
- Metering analysis — the charts and the data quality view
- Roles and permissions